Friday, January 31, 2025
How To Measure the Risk of Expected Rates of Return?
Monday, October 21, 2024
How To Calculate Expected Rates of Return?
Risk is the uncertainty that an investment will earn its expected rate of return. An investor who is evaluating a future investment alternative expects or anticipates a certain rate of return.
As an example, an investor may know that about 30 percent of the time the rate of return on this particular investment was 10 percent. Using this information along with future expectations regarding the economy, one can derive an estimate of what might happen in the future.
The expected return from an investment is defined as:
The investor might estimate probabilities for each of these economic scenarios based on past experience and the current outlook as follows:
The computation of the expected rate of return [E(Ri)] is as follows:
How To Compute Arithmetic Mean & Geometric Mean
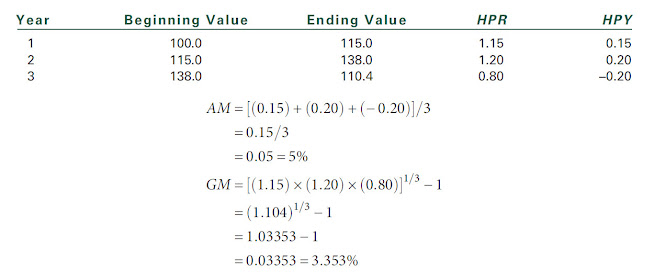
Single Investment Given a set of annual rates of return (HPYs) for an individual investment, there are two summary measures of return performance. The first is the arithmetic mean return, the second is the geometric mean return. To find the arithmetic mean (AM), the sum (Σ) of annual HPYs is divided by the number of years (n) as follows:
Where:
ΣHPY = the sum of annual holding period yields
An alternative computation, the geometric mean (GM), is the nth root of the product of the HPRs for n years minus one.
Where:
π = the product of the annual holding period returns as follows:
To illustrate these alternatives, consider an investment with the following data:
How To Measure Holding Period Yield & Annual Holding Period Yield
Sunday, October 20, 2024
What Is Historical Rates of Return?
When you are evaluating alternative investments for inclusion in your portfolio, you will often be comparing investments with widely different prices or lives. As an example, you might want to compare a $15 stock that pays no dividends to a stock selling for $250 that pays dividends of $10 a year. To properly evaluate these two investments, you must accurately compare their historical rates of returns. A proper measurement of the rates of return is the purpose of this section.
If you commit $200 to an investment at the beginning of the year and you get back $220 at the end of the year, what is your return for the period? The period during which you own an investment is called its holding period, and the return for that period is the holding period return (HPR). In this example, the HPR is 1.10, calculated as follows:
Definition Of Investment

Investment can be defined as the current commitment of dollars for a period of time in order to derive future payments that will compensate the investor for (i) the time the funds are committed, (ii) the expected rate of inflation during this time period, and (iii) the uncertainty of the future payments. The “investor” can be an individual, a government, a pension fund, or a corporation. Similarly, this definition includes all types of investments, including investments by corporations in plant and equipment and investments by individuals in stocks, bonds, commodities, or real estate. This text emphasizes investments by individual investors. In all cases, the investor is trading a known dollar amount today for some expected future stream of payments that will be greater than the current dollar amount today.
Hence, the question is why people invest and what they want from their investments. They invest to earn a return from savings due to their deferred consumption. They want a rate of return that compensates them for the time period of the investment, the expected rate of inflation, and the uncertainty of the future cash flows. This return, the investor’s required rate of return, is discussed throughout this book. A central question of this book is how investors select investments that will give them their required rates of return.
What Factors do Influence the Nominal Risk-Free Rate (NRFR)?
A n investor would be willing to forgo current consumption in order to increase future consumption at a rate of exchange called the risk-fr...
.png)
.png)
.png)
.png)
.png)
.png)
.png)


.png)

.png)
